Every stop, its reason, and what it cost in production.
Downtime analysis turns stops into a list you can act on: which machines stop, why, for how long, and which few reasons cost the most.
Captured at the machine
When a machine stops during a batch, Nisthora records the start and end time from the machine itself. The operator taps a picture on the panel to say why. No paper, no typing, no guessing at the end of the shift.
Stop reasons belong to six groups, so you can see the pattern as well as the detail:
- Mechanical, electrical: something broke
- Quality: stopped because parts were bad
- Waiting: no material, no operator, no instructions
- Setup: changeovers and adjustments
- Planned: breaks, cleaning, planned maintenance
Each plant sets up its own reason list, with its own words and colours.
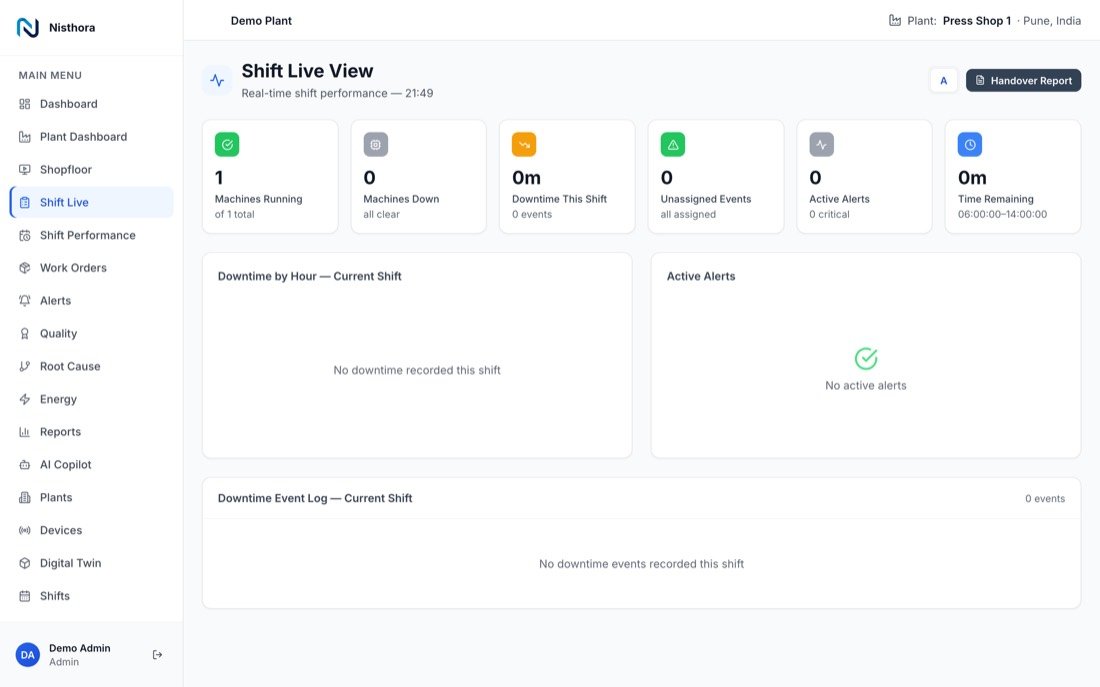
The few causes that cost the most.
Tools for finding lost time.
Downtime log
Every stop with machine, start, end, length, reason and note.
Pareto chart
Reasons sorted by lost time, with a running total.
MTBF
Mean time between failures: how long a machine runs, on average, before it breaks down.
Shift report
Downtime by shift, ready for the morning meeting.
Fix a reason later
A supervisor can correct a stop's reason after the fact.
Gaps are shown, not hidden
If readings go missing, Nisthora knows and says so, rather than counting it as running.
Machine and line view
See lost time per machine, and per line.
Investigate
Open a root cause investigation from any stop, with the details filled in.
See Nisthora on your own machines.
Book a demo. We will show you live data and talk through your machines, lines and shifts.
Book a demo