Dashboards

The right view for every person in the plant.

From the operator's machine to the owner's phone, every dashboard shows the same trusted numbers, live, cut the way that person needs them.

Plant dashboard

Today, live. History in one click.

The plant dashboard shows today's production day as it happens: OEE, good units, downtime and quality, for the whole company or one plant.

  • Today follows your production day, even when the night shift crosses midnight
  • History for the last 7, 15, 30 or 45 days
  • Plant quality is weighted by units made, so a small line does not skew it
  • Drill down from company to plant to line to machine
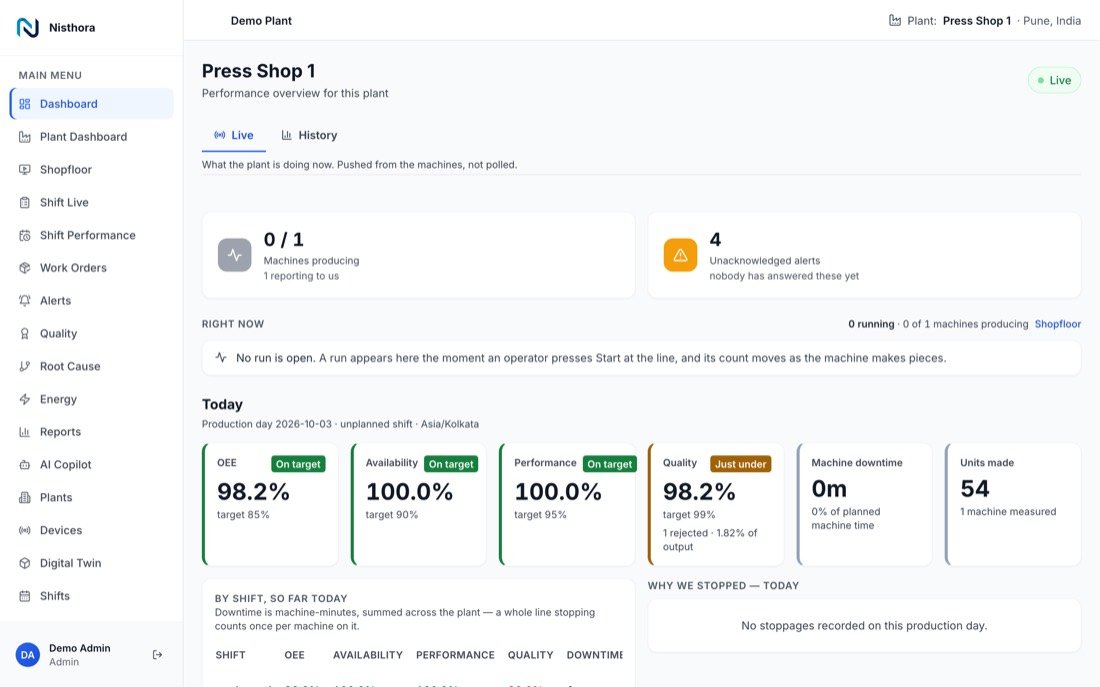
Plant dashboard with OEE, good units, downtime and quality tiles
Shop floor board

Every machine on one screen.

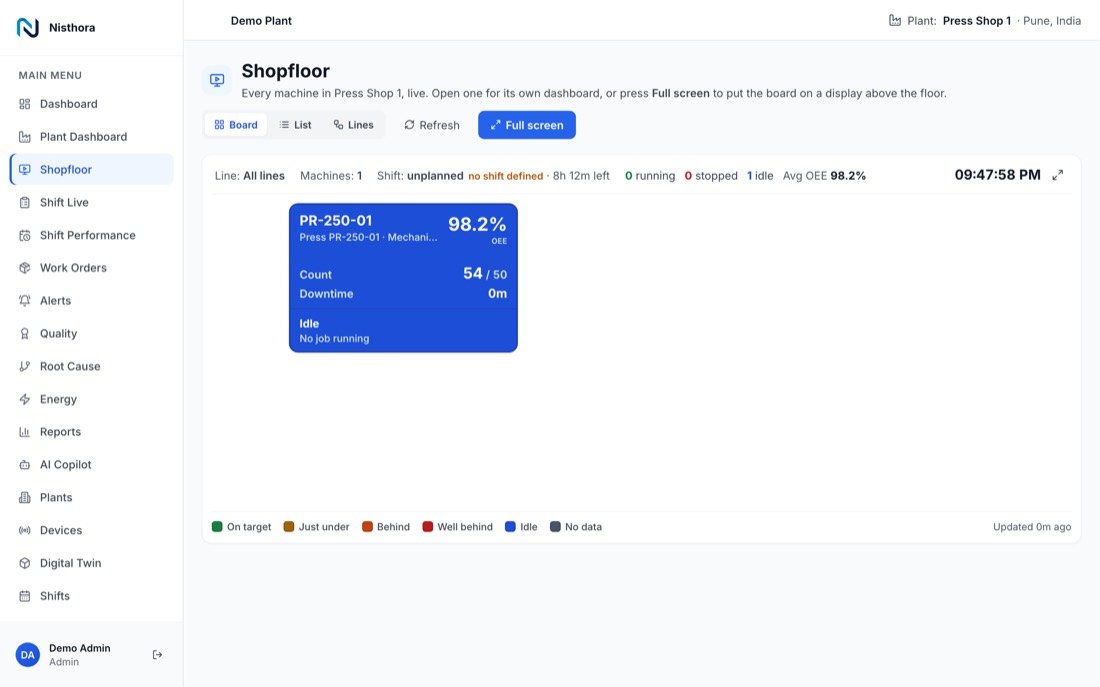
A live tile for every machine: running, stopped or offline, the current batch, and OEE so far. Built for a big screen on the shop floor.

  • Colours that read from across the shop
  • Updates the moment a machine starts or stops
  • Shows TV-friendly boards without anyone logging in
Shop floor board with a live tile for each machine
Shifts

See the shift while it runs, and compare it after.

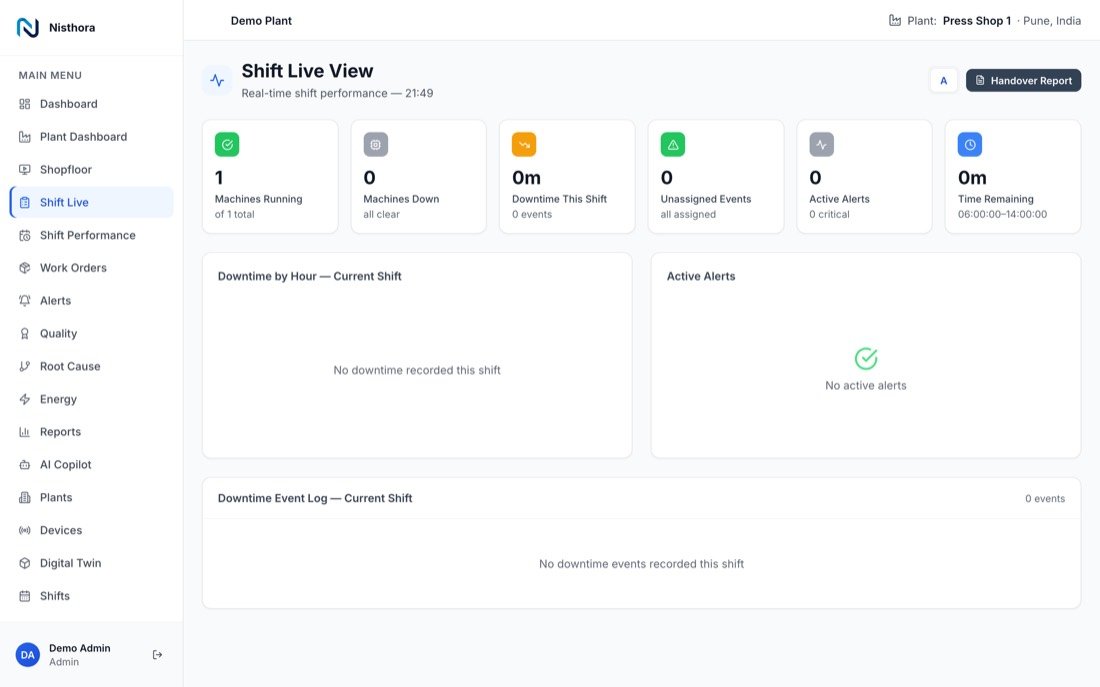
Shift Live shows the current shift minute by minute. Shift Performance compares shifts side by side.

  • Output, downtime and quality per shift
  • Which shift did best, and on which machines
  • Planned time follows your production plan, not only the shift clock
Shift live view with machines running, downtime this shift and active alerts
Quality and energy

Rejects and power, where they happen.

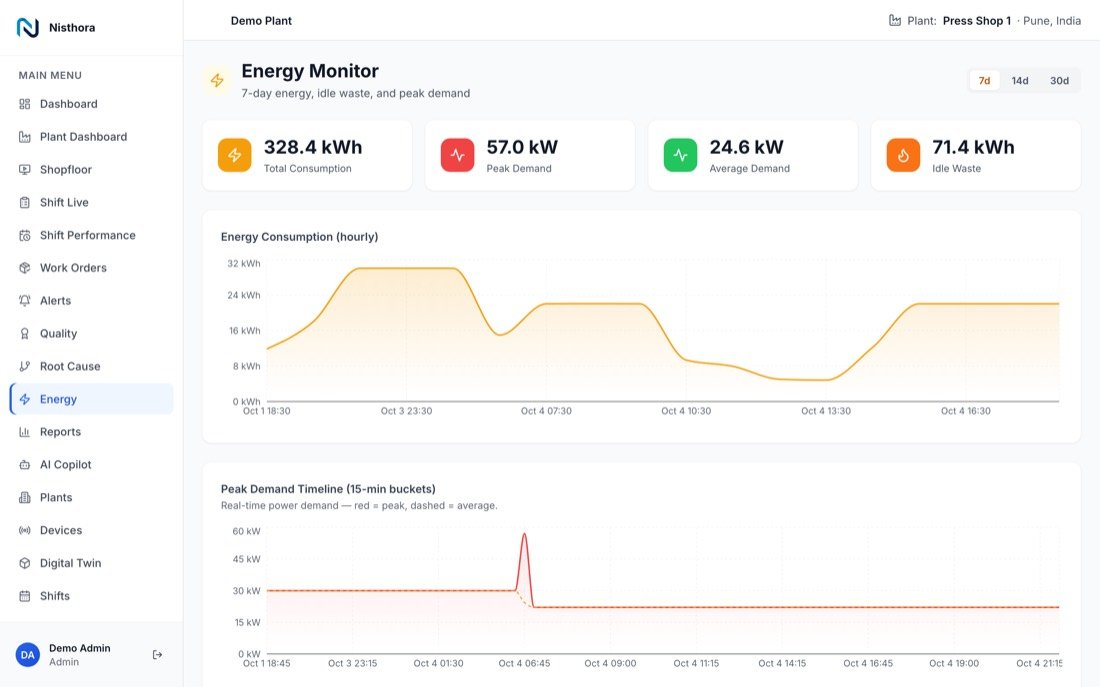
The Quality page shows good and rejected units by machine, batch and shift. The Energy page shows power use by machine and line.

  • Batches losing the most to rejects, ready to investigate
  • Energy use and carbon trend per machine and line
  • Start a root cause investigation from any bad batch
Energy page showing power use by machine and line
Dashboard builder

Build your own boards. No code.

Drag widgets onto a board, or start from a template.

OEE gauge and donut

OEE and its three parts for a machine, line or plant.

Downtime Pareto

Stop reasons sorted by lost time.

Machine status cards

Live state of each machine.

Telemetry chart

Any reading over time.

Anomaly score

How unusual a machine's readings look right now.

Predictive alert

Machines the model expects trouble from.

Energy meter and carbon trend

Power use and its trend.

Heat map

Spot patterns by hour and day.

Production log

Recent batches and counts.

Shift progress

Where the shift stands against plan.

Alerts feed

Live alerts for the board's machines.

Counters and bar charts

Any number you want on the wall.

Templates to start from: OEE Overview, Energy Monitor and Anomaly Feed.

Digital twin

Your plant floor, live.

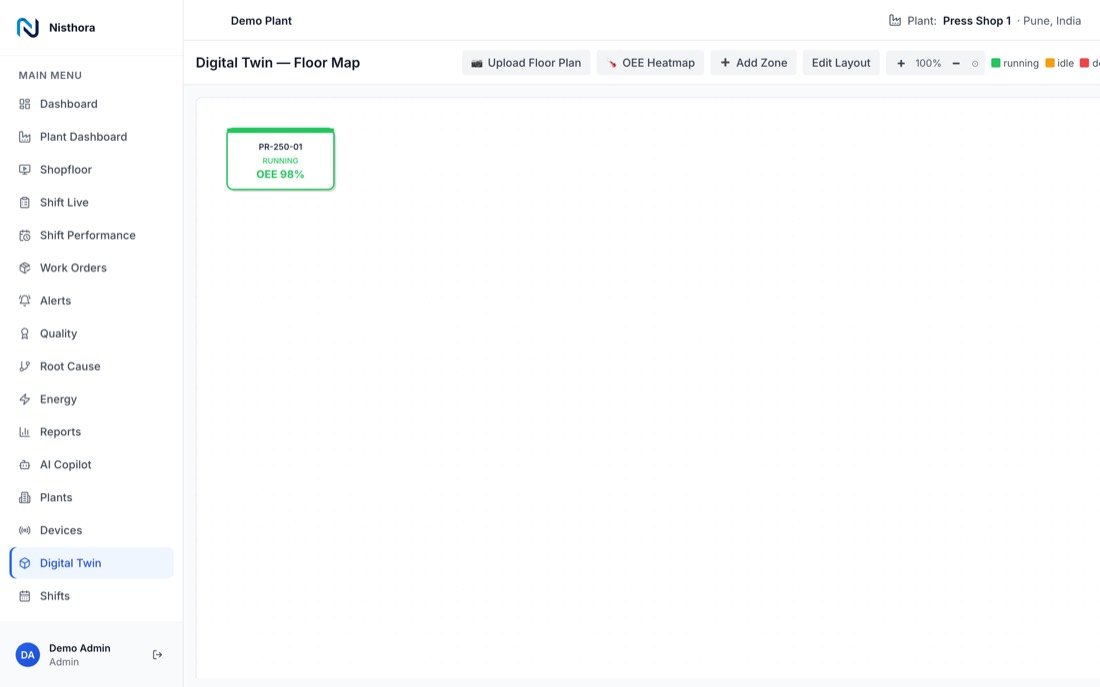
Place machines on your own floor plan and see their state where they really stand.

  • Upload your own floor plan
  • Each machine shows running, idle or stopped, and its OEE
  • Switch to an OEE heat map to spot the weak areas at a glance
Digital twin floor plan with live machine states

See Nisthora on your own machines.

Book a demo. We will show you live data and talk through your machines, lines and shifts.

Book a demo